EssaysVolume7
The Collected Essays of
Richard A. Stanford
Essays on Economic Growth and Development
Richard A. Stanford
Furman University
Greenville, SC 29613
Copyright 2022 by Richard A. Stanford
CONTENTS
NOTE: You may click on the symbol <> at the end of any section to return to the CONTENTS.
Economic Implications of ...
1. Growth and Development
2. Growth and Comparative Advantage Specialization
3. Contravening Comparative Advantage
4. Growth and Immigration
5. Productivity and Growth
6. Growth and the Environment
7. Growth and Poverty Alleviation
8. Growth and Distributional Inequity
9. Redistribution or Growth?
10. Policies that Promote Growth
11. U.S. Growth in the Twenty-first Century
12. Growth and Normal Operating Capacity
13. Aggregate Demand and Supply
14. Aggregate Demand Growth Rate
15. Growth and Supply Shocks
16. Growth and the Natural Rate of Interest
17. The Malthusian Growth Model
18. Technological Advance and Demographic Transition
19. Depopulation and Immigration
20. The Harrod Growth Model
21. The Solow Growth Model
<Blog Post Essays>
<This Computer Essays>
1. Growth and Development
Economists distinguish between economic growth and economic development. "Growth," taken to be an improvement in the material well-being of humans, is usually measured as the rate of increase of per capita real income or output of a society. "Real" means that adjustments have been made to eliminate the effects of inflation so that the real component of nominal income increase can be examined. "Per capita" means that some measure of the total output of a society, typically its Gross Domestic Product (GDP), has been divided by the population of the society to get a measure of income on a per-person basis.
"Development" is understood to mean change in the structure of society. The various dimensions of social structure include economic, social, political, moral, religious, and environmental. Development is both a requisite of growth and a consequence of growth--they are inseparable.
A serious problem is that development is typically disruptive of social structures, and thus entails costs. While by definition growth yields only benefits, development seems to involve mostly costs. A rational judgment of whether a process of development cum growth is desirable should be based on the relationship between the benefits of growth against the costs of development, i.e., Bg/Cd. If the value of the ratio of Bg/Cd is greater than 1, the growth-development process is desirable. It is undesirable if the value of the Bg/Cd ratio is less than 1.
Economists make the case that the most effective poverty alleviating vehicle over the past couple of centuries has been economic growth, and that market economies are more favorable to growth than are authoritarian regimes.
A modern economist is led to the suspicion that the suffering of the poor may be less amenable to relief by sharing the existing wealth than by a process of economic development that increases the society's stock of capital (which is part of its physical wealth). The poor are helped via the "spill-over effects" of employment and income generation, and in terms of a growing volume of lower-priced consumables that are more affordable to the poor.
There is a good bit of evidence in the literature of economic development that with continuing growth of the global economy, income per capita has risen. Even the poor at the lower end of the income spectrum usually enjoy welfare gains, although the gap between their incomes and those of the wealthy (successful entrepreneurs) may widen. This is not to deny that some elements of any society may become worse-off as economic development ensues, but the same probably would be happening in a stagnant economy. Even so, I am compelled to the conclusion that there is likely to be greater potential for relief of poverty in entrepreneuralizing the world's scarce resources than in socializing them. The most likely outcome of the latter is to ensure the perpetuation of poverty.
Because of continuing economic growth over the past couple of centuries, most people have become materially better-off than their predecessor generations. And those who live in the societies that have enjoyed the fastest rates of economic growth may “live like kings” relative to people in societies that have experienced little or no growth. An “international demonstration effect” occurs when people in low-income societies become aware of higher living standards in societies that have enjoyed faster rates of economic growth. International demonstration effects have motivated people in low-income countries with authoritarian political regimes to try to achieve the benefits of faster economic growth by replacing their regimes with democratic polities coupled to market economies.
It is a rough and imperfect analogy that "A rising tide floats all boats." Economic growth makes a society on average better-off, but some become better-off faster than others, and some may actually become worse-off, thereby worsening both local and global distributions of income and wealth. Even if those toward the lower end of an income or wealth distribution have become materially better-off, a widening distribution tends to breed resentful envy among those at the lower end of the distribution toward those closer to the top.
Resentful envy may spill over into social dissatisfaction and political unrest. Possible outcomes might be parliamentary efforts to curb the income earning or wealth accumulation abilities of those toward the upper end of the distribution, or to redistribute income and wealth from those at the upper end of the distribution to those at the lower end. A more extreme outcome might be a movement (parliamentary or revolutionary) to replace market capitalism with some form of socialism.
In the early twenty-first century, we see low-income societies with authoritarian regimes attempting to achieve the growth benefits of successful market economies with democratic polities. It is ironic that at the same time we find in higher-income market economies with democratic polities efforts to achieve distributional equity by socializing the distributions of income and wealth
2. Growth and Comparative Advantage Specialization
The world is composed of many economic regions, some of which are similar to others in respect to resource endowments, preferences, or technologies, and different from the other regions in various respects. Economic growth occurs at different paces in different regions of the world.
According to the principle of comparative advantage, people in each region of the world should specialize in producing those goods and services that can be produced most efficiently in their region compared to other regions. "Most efficiently" means at least opportunity cost (in terms of other goods and services foregone) compared to the other regions. Since the production of goods becomes geographically specialized, people in different regions must trade their specialties for the specialties of people in other regions.
Economists who specialize in international trade matters argue that all of the regions of the world, the sparsely endowed as well as the abundantly endowed, will enjoy higher welfare if they specialize production in their respective comparative advantaged goods and services and then trade with one another unencumbered by politically imposed constraints. The process of specialization enables and promotes economic growth in each region
Modern elaborations of the theory of comparative advantage recognize at least five bases for regional comparative advantages: resource endowments, cultural preferences, known technologies, scale economies, and company-specific knowledge. The first three are endogenous to locale; the last two technically are independent of geography, but they may become location specific at the discretion of production decision makers.
But regions don't seek and identify comparative advantages, individuals and business enterprises do. Business decision makers, seeking profitable investment opportunities, attempt to "outfox" rivals by discovering competitive advantages (new demands for goods and services) of their own and other regions, and then to exploit market opportunities to supply goods and services both locally and abroad. Regional comparative advantages can develop only when microeconomic business decision makers "see" potential competitive advantages. The process of discovering and exploiting markets is central to regional comparative advantage specialization which enables economic growth.
If government officials do not become involved, the
private-sector pursuit of competitive advantages can be counted on to achieve
comparative advantage specialization that promotes economic growth by providing
goods and services at least opportunity costs (what must be given up) to all
parties through interregional trade. The by-products of specialization and
trade are welfare increases of the trading regions and faster economic growth.
The theory of comparative advantage, now nearly universally accepted by economists, holds that nations ought to specialize their production in the goods and services that they can produce at lowest opportunity costs (i.e., their comparative advantages) in order to achieve global resource allocation efficiency, welfare maximization, and maximum growth.
Governments
sometimes attempt to contravene the comparative advantages of their own regions
and those of their trading partners by creating artificial advantages for their
domestic producers or neutralizing the comparative advantages of their trading
partners. They do this by implementing protectionist measures that offset
the comparative advantages of their trading partners. Government policies
designed to contravene comparative advantages have dampened the prospects for
economic growth.
Tariffs and Non-tariff Barriers to Trade
Protectionism becomes manifest in the enactment of tariffs on imports, subsidies for domestic producers, and so-called “non-tariff barriers” (NTBs, e.g., quotas on imports, health and safety restrictions on imports, import packaging and labeling requirements, discriminatory performance standards for imports, etc.) that are intended to curb imports or raise their delivered prices. Such policies inevitably slow the rates of economic growth of both the region that implements them and those of its trading partners.
Protectionist policies may expand or preserve employment and enterprise opportunities for the country’s own workers and companies, but it diminishes freedom of enterprise and employment opportunities within the trading partners. Labor unions are almost universally in favor of “leveling the playing field” (i.e., neutralizing the foreigners’ comparative advantages) by implementing protectionist policies.
Government may attempt to neutralize another region's comparative advantage by imposing an import tariff that is intended to eliminate a foreign cost advantage. The government may impose an import quota as a means of limiting the damage resulting from importation of an item that can be produced at lower cost elsewhere. Or the government may take "compensatory" action in any of these areas to offset some policy being implemented by the government of another region. In any of these cases of protection, the effects have been to diminish gains from comparative advantage specialization and slow rates of economic growth.
Governments occasionally attempt to contravene natural or acquired comparative advantages for non-economic reasons. The most obvious such reason is the perception of national security. This reason may become critical during a period of hostilities as has been witnessed in early 2022 during the Russian invasion of Ukraine. The United States and European Union members have imposed sanctions and suspended the import of items for which Russia has comparative advantages, e.g., natural gas, oil, and various minerals. Such interruptions of international trade inevitably diminish the benefits of specialization and slow economic growth.
Protectionist policies implemented by the government of a country also limit the consumer sovereignty of its own people by narrowing their range of consumer choice (including making religious and charitable contributions), but at the same time they increase the range of consumer choice for people of its trading partners.
When a government implements protectionist policies, it risks eliciting rising protectionist pressures in its trading partners. Rising protectionism is dangerous because it tends to induce reciprocal protectionist responses by trading partners. The US Smoot-Hawley Tariff Act of 1930 did just this, and it spawned global protectionism that aggravated the Great Depression.
Government may attempt to protect an old domestic industry in order to preserve a comparative advantage that is fleeing to foreign regions. An example is the cotton textile industry as it moved from the South of the United States to East and South Asia. Such protection may take the forms of subsidies to the domestic industry, quotas, or tariffs imposed on imported merchandise. Or, the government may promote the development of what is believed to be a latent comparative advantage of the region by subsidizing a so-called "infant industry." Recent examples of this are the developing electronics industries in India and Singapore.
Import Substitution Industrialization
In the post-World War II era, governments in a number of countries, many in Latin America and East Asia, pursued import-substitution industrialization (ISI) policies in efforts to contravene their natural comparative advantages or develop new or latent comparative advantages. The usual vehicles of ISI policy implementation have been subsidies for domestic producers and tariffs on imported goods that would compete with domestically produced goods, with the intent of reserving the domestic market for exploitation by domestic companies.
The motivations to
implement ISI policies have included the desire to achieve autarky, i.e.,
internal self-sufficiency in the production of all goods and services consumed
in the region, or to give selected domestic industries a chance to develop and
“grow up” to become internationally competitive. At various times Japan, China,
Russia, and some Latin American nations have adopted ISI development policies.
In response to the sanctions imposed recently by Western nations on Russia in regard
to its invasion of Ukrane, Russia has move toward attempting to achieve
autarky.
While ISI policies
have attempted artificially to broaden domestic entrepreneurial opportunities
at the expense of foreign firms, they have also narrowed the range of consumer
choice to higher-cost domestic goods. In most countries where ISI policies
have been attempted and failed, they have been succeeded by export-oriented investment
(EOI) policies that exploit the country’s natural comparative advantages. EOI
development policies also have stimulated economic growth of the regions where
they have been implemented.
4. Growth and Immigration
Population growth can be a nation's boon or its bane. For a nation with a low birth rate and an ageing population, population growth can be its boon. For a nation with a high birth rate, ensuing immigration, and an already large population for its land and capital resources, further or faster population growth will be its bane.
One nation's comparative advantages relative to those of
other nations depend very much on their labor forces and their stocks of land
and capital. Nations with large endowments of labor but minimal arable land and
little capital compared to other nations will have comparative advantages in
producing labor-intensive goods in craft shops or primitive factories. Nations
with ample capital stocks but small amounts of land and labor compared to other
nations will have comparative advantages in producing capital-intensive goods
in industrial facilities.
Both types of nations can enjoy each other's products and increase their welfares by trading with one another. Emigration from the labor-abundant nation that becomes immigration into the capital-abundant nation will tend to increase labor productivity and wages in the former and decrease them in the latter. Emigration/immigration thus will tend to level wage rates across the two nations.
Nations with stable or declining populations often suffer low or negative rates of economic growth. Immigration may be just what a nation with low birth rates and an ageing population needs to spur and sustain its rate of economic growth. Although the new arrivals may tend to decrease average labor-force productivity, they will become consumers that stimulate the demands for domestically produced goods and services and provide more employment opportunities.
High-income nations with low or negative population growth rates may have difficulty achieving and sustaining positive economic growth. One way in which such nations can sustain positive economic growth is to tolerate and even invite immigration from low-wage, high population-growth-rate regions of the world. Those who emigrate from their low-wage and economically stagnant environments tend to be the more capable and driven members of those societies.
However, immigration, legal and otherwise, has been shown in many regions to precipitate local opposition on racial, ethnic, lingual, religious, and employment grounds. The employment issue is that immigrants who are willing to work at lower wage rates than locals take the jobs that "rightfully belong" to the locals, and thus tend to cause rising unemployment among the local labor force.
The counter argument is that although in the short run
immigration tends to have a wage-leveling effect of immigration, the longer-run
effects are that the immigrants bring new human capital and entrepreneurial
drive, pay taxes, and increase demand for the economic output of the region,
thereby stimulating economic growth. And it has often been observed that the
low-wage jobs that recent immigrants take involve sweaty hard work that
citizens often try to avoid.
5. Productivity and Growth
During the last half of the 20-teens, U.S. non-farm business productivity decreased, restrained by weak business investment in new equipment and software. The declining productivity restrained the economy's ability to grow fast enough to generate higher incomes without stoking inflation. Wage growth, which is enabled by increasing labor productivity, also was curbed.
There are two basic ways to increase labor productivity: (1) give workers more and better equipment with which to work; and (2) use fewer workers to do the same work formerly done by a larger work force using the existing equipment. Labor productivity may also increase if the equipment stock increases faster than the number of workers increases
Conversely, decreases of labor productivity may be attributable to: 1) continuing real depreciation of the equipment that workers use without replacement; and 2) employing more workers to use the existing equipment. In fact, both phenomena have been occurring recently in the U.S. economy: managements have been reluctant to replace depreciating equipment until demand increases with faster economic growth, and employment has been increasing as more people enter (or return) to the labor force.
Wage growth in the U.S. economy has been stagnant recently because the supply of labor has been increasing faster (with continuing population growth and the return of "discouraged workers" to the labor force) than the demand for labor has been increasing. The demand for labor has been depressed by the slow growth of the economy. But the economy won't be able to grow faster without faster productivity increases, a veritable Catch 22. And increasing labor productivity is dependent upon additional capital investment which also is depressed by slow economic growth prospects, i.e., a double Catch 22.
Why has economic growth recently been so slow? Three reasons: uncertainty about the political scene, excessive governmental regulation of business, and high corporate income and capital gains tax rates. These matters should be addressed by the political process to apply appropriate fiscal and regulatory policies, but our political institutions have avoided this course of action and looked to the central bank to resolve the problems with monetary policy.
In attempting to address the slow-growth phenomenon, the Federal Reserve continually reduced interest rates toward zero and engaged in "quantitative easing" (a.k.a. open market operations) by purchasing government debt from banks and the government itself. But in the same sense that "You can lead a horse to water, but you can't make it drink," the Fed can provide additional liquidity to commercial banks, but it can't force commercial bankers to lend or business managers to borrow.
The additional liquidity provided to banks resulted in little additional lending to businesses since the slow growth has left both the demand for industrial output and investment in new capital stock depressed. But the additional liquidity "sloshing about" in the world economy has caused price bubbles in the housing, commodities, and financial markets, and eventually it caused across-the-board general inflation. Most recently the quantitative easing and negative real interest rates have resulted in a bond bubble.
Economists recognize that growth and productivity are
problems that the Fed can't solve by itself with monetary policy alone. Actions
that must be taken to solve
the problems of slow economic growth, stagnant productivity, and restrained
wage growth require actions beyond the capabilities of the central bank. These actions include stabilizing the political environment; eliminating the most onerous and costly regulation of the
business sector; lowering U.S. corporate income and capital gains tax rates to globally competitive
levels; and increasing government spending on national infrastructure. Once these matters are
settled, monetary policy may return to a state of effectiveness and relevance.
6. Growth and the Environment
Economics is about the scarcity of productive resources relative to the wants of humans for the products that can be produced from those resources. Economics is about economizing, conserving, and allocating those scarce resources to achieve efficiency and productivity (the ratio of outputs to inputs) in the process of enhancing the material well-being of society.
By the very nature of their subject matter, economists
are interested in conserving the environment, and they favor long time horizons
that stretch to some number of future generations and their well-beings. There
is no essential conflict between economic and environmental concerns as long as
the sides of any environmental and growth discussion are given due
consideration and benefits are rationally judged against costs. There is
substantial overlap between the interests of growth economists and
environmentalists, but if either pushes too far toward their respective
extremes (environmentalists to stop growth, or growth economists to ignore
environmental concerns), the mutuality of interest evaporates.
Benefits and Costs
There may be some asymmetry of assessment of benefits and costs between those who promote growth and those who favor environmental protection and restoration. Growth advocates go to lengths to identify the benefits of growth and may overestimate the values of them while overlooking or minimizing the costs of development. Avid environmentalists tend to the opposite extreme, i.e., identifying all of the costs of development and overestimating their magnitudes, while overlooking or undervaluing the benefits of growth.
Growth economists and environmentalists seem to have become more suspicious and skeptical of each other. Environmentalists often indict economic growth as the principal villain in despoiling the environment. Growth economists suspect that an ardent advocacy of environmental sustainability actually may be a veiled "stop-growth" movement. Growth economists are firmly convinced that on-going growth serves the larger humanity by improving material well-being across the income spectrum, and especially among the poorest in low-income societies. But there are always tradeoffs. A cost of growth that improves material well-being may be usage of resources that may be perceived as environmental damage. The rational question is whether the benefit is worth the cost.
Environmental advocates occasionally express the view
that when some gain from the environment, others must have suffered loss. Most
economists would not be sympathetic to that viewpoint, and would relegate it to
the pre-Industrial Revolution era of Mercantilism. There is much evidence that
economic activity is not a "zero-sum game," but rather a positive-sum
game. Economic activity is quid pro quo, i.e., trading this for that. Unless
such trading is dictated by authority, it is voluntary so that both parties to
any such trade have to perceive that they will gain in order for the trading
activity to ensue. When some part of the environment is despoiled by
"greedy industrialists" (the development) who may gain profit (or
suffer loss), there are other members of society who are made better off,
namely the consumers of the products flowing from the industrial activity (the
growth). Environmentalists seem to stress the "rapacious" nature of
industrial despoilage but ignore the "pro quo" that accompanies it.
Resource Extraction
The extraction of mineral and petroleum resources certainly leaves less of them in the earth so that it appears that stocks of natural resources are being depleted. However, at the end of World War II the best estimates available were that the world may have had around 40 more years of coal if it continued to be extracted at mid-twentieth century rates. Early in the twenty-first century, and with accelerating extraction of coal, current estimates are that we may have two or more centuries worth still available. How can this be? Technological advance has increased the efficiency with which we use our coal resources, and processes of exploration and discovery have identified and proven previously unknown coal deposits. And, technology is advancing with respect to the ability to burn coal (or coal-derived products) with ever-less ejection of carbon and particulate matter into the atmosphere. There are even hints of technologies to be developed that may be able to extract carbon from the atmosphere and either bury it below the sea floor or make other useful products with it. Similar stories can be told with respect to many other natural resources.
The very same process of technological advance that is making progress to conserve the earth's resources and enable more efficient and cleaner usage of them often is indicted by environmentalists for despoiling the environment. Growth economists maintain that even as the physical resource stocks of the earth's natural resources are depleting, the "effective stocks" continue to be increased by technological advances.
Global Warming
There is a good bit of "long-view" evidence that the earth has been cyclically warming and cooling through the ages. The present warming trend is not unlike that about twelve thousand years ago around the end of an ice age. Whether human activity is responsible for or has aggravated the present warming trend is uncertain. Global warming, whether a natural phenomenon or caused by human activity, may impair the productive capacity of tropical and arid regions of the earth, and thus further impoverish the populations of those regions. But global warming is also likely to extend the growing seasons of more northerly regions, and thus enhance their productive capacities. Environmentalists seem to focus on the former and underestimate the latter possibility.
Since it is not yet apparent that human effort can
actually suspend the global warming process, the solutions to the human problem
lie in open borders. This means trade and immigration, unilateral transfers
(e.g., foreign aid and benevolence by religious and other charitable organizations)
from those regions that are gaining to people in regions that are suffering
from global warming. This also means the transfer of new technological
knowledge to those regions that are suffering to enable them to adapt to the
global warming process.
Religion
John Kay, in his January 9, 2007, column in the Financial Times, conjectured that environmentalism now has achieved all of the requisites of a religion in its own right. It possesses a myth story of "The Fall" in the form of the loss of harmony between man and nature caused by our materialistic society, and an apocalypse myth story in the form of human wickedness that has damaged our inheritance. However, there is no redemptive story in environmentalism that would provide an object of worship. It might be more appropriate to call environmentalism an advocative secular ideology rather than a religion. There is something to advocate from an ideological perspective, but nothing to worship from a religious perspective.
In comparison, economic growth emanating from the operation of market economy has an apocalypse myth story, the "dismal" population growth story told in 1798 by Church of England Parson Thomas Robert Malthus in his Essay on Population. In Malthus' story, continuing population growth will press upon the carrying capacity of the earth, causing per capita incomes to fall and hover about the subsistence level, and massive starvation if population growth should continue to grow beyond the carrying capacity of the earth. Malthus invoked the "four horsemen of the Apocalypse" described in the New Testament book of Revelation as the vehicles that would ultimately limit population growth: war, pestilence, famine, and disease.
But growth economics also has two redemptive stories in the forms of on-going technological advance that extends the carrying capacity of the earth, and demographic transition that curbs population growth. In a demographic transition, as people become more affluent they want to have fewer children, hence birth rates fall toward death rates. In this reality (more than a myth story), technological progress has enabled global output to outrun population growth, and demographic transition is reducing the global rate of population growth. On-going economic growth has enabled per capita incomes to continue to rise and alleviate poverty. The Malthusian Apocalypse is thus averted. Economic growth may be closer to being a religion (a secular religion) than is environmentalism.
7. Growth and Poverty Alleviation
Economists make the case that the most effective poverty-alleviating vehicle over the past couple of centuries has been economic growth, and that market economies are more favorable to growth than are authoritarian economies. A modern economist is led to the suspicion that the suffering of the poor may be less amenable to relief by sharing the existing wealth than by a process of economic development that increases the society's stock of capital (which is part of its physical wealth). The poor are helped via increasing employment and income generation. They are also helped by a growing volume of lower-priced consumables that are more affordable to the poor.
Although economic growth has been the principal alleviator of global poverty during the past couple of centuries, economic growth might serve as a vehicle for diminishing income distribution inequality if some way can be found to suppress the capture of monopoly incomes and to cause entrepreneurial profits to be shared more evenly with the working class.
However, growth also may be a culprit in worsening the distribution of income due to the fact that entrepreneurial success in the private sector is rewarded by profit which propels successful entrepreneurs into the upper-income echelons. More steeply progressive taxation would curb the accumulation of wealth from entrepreneurial success but capture of a too-great portion of entrepreneurial profit by progressive taxation may also "kill the goose that laid the golden egg." And it is not clear how the fruits of entrepreneurial success captured by progressive taxation can help the lower half of the income distribution without redistribution.
Until the nineteenth century, most people could only hope to sustain well-being at the level experienced by their parents. Few expected well-being improvement from generation to generation, and most hoped only to avoid famine, war, disease, and other causes of decreasing well-being. Economic growth, in the sense of improvement in the lives and well-beings of populations, was not an active phenomenon, and did not even begin to be expected until at least the nineteenth century. But here in the twenty-first century we have become so spoiled to on-going improvement in the well-being of populations almost everywhere in the world that people become anxious if they don't get an adequate boost of well-being right on time every year.
Since the turn of the nineteenth century, economic growth
has become the principal alleviator of poverty, far outpacing both voluntary
redistribution (giving between individuals and groups) and involuntary
redistribution via progressive taxation and government safety net programs. But
global growth has slowed in the wake of the 2008 Great Recession and
governmental efforts to revive growth processes have had minimal effects. The
very low rates of growth of the U.S. economy recently demonstrate this point.
8. Growth and Distributional
Inequity
Distributional inequity of incomes across the population of a region impairs the process of economic growth.
Inequality in the distribution of something across a population is a descriptive or factual matter. Inequity is a subjective matter, a matter of perception that the degree of factual inequality is unsatisfactory. A regional income that is perceived to be too unequally distributed across the population of the region may be judged to be inequitable. By the same token, a perfectly equal distribution of income across a society that values productive contribution and rewards merit also might be judged to be inequitable. In such a society, some distributional inequality attributable to reward for meritorious productive effort might be accepted as equitable.
The economic implication of distributional inequity is opportunity loss of consumer spending discretion at the lower end of the income spectrum. Even though parties toward the upper end of the income spectrum may enjoy greater spending discretion, it is rarely enough to offset the loss of spending discretion at the lower end.
The poor often spend most or all of their incomes, and some may even spend more than their incomes by increasing debt. But the more affluent typically spend a smaller proportion of their incomes. The asymmetry of spending behavior by the rich and the poor constrains the economic growth potential of a region.
The perception of distributional inequity may result in social and political unrest that leads to demands for redistribution. It may culminate in protests and ultimately revolution to overturn the government.
In economic thought, an equitable distribution of income occurs if all resources (human as well as physical) receive returns (incomes) that are equal to their marginal revenue products. Marginal revenue product is the addition to total revenue from selling what is produced by employing one more unit of the resource.
An equitable distribution of income is not likely to be a perfectly equal distribution of income. Resources have differing capacities to generate additional product due to varying inherent characteristics, designs, education, training, entrepreneurial drive, etc. Also, products have differing market values. The marginal revenue product of an item varies with both physical productive efficiency and market demand for it. Even if the physical production of an item is very efficient, insufficient demand for it will cause its marginal revenue product to be low.
Those who receive returns less than the values of their marginal products are exploited and become (or remain) poor. Slavery (humans owned as chattel property) is the ultimate form of exploitation by marginal revenue product extraction. The diminished marginal revenue products of the exploited impair the potential for the economic growth of a region.
The rich may (or may not) use their accumulated wealth
for charitable purposes that benefit the poor, but even if they do so they are
exercising discretion over the uses of society's wealth. The exploited poor are
unable to exercise any such discretion over the use of wealth that they could
have accumulated had they not been exploited. In the absence of exploitation,
they may not have been or remained poor, and the prospect of economic growth
may have been enhanced.
9. Redistribution or Growth?
Inequality in the U.S. distribution of income has become a prominent issue since the 2016 U.S. presidential election. The progressive/liberal approach to redressing the imbalance between the upper and lower halves of the income distribution has been redistribution. Conservatives have favored relying on economic growth via entrepreneurial investment to "float all boats." The problem has been that the "boats" of the upper-income recipients have risen while those of the lower-income recipients seem to have remained at about the same level over the past 30 years.
Governmentally implemented redistribution has been an ineffective means of redressing the income distribution imbalance, but the available vehicles for ameliorating the income distribution inequality are yet more actions for government to undertake. As such, they fall well within the liberal-progressive arena, and many of them are already underway. Unspecified is any means by which the distribution of human and financial capital is to be equalized without some form of redistribution or quota allocation of opportunity.
Omitted is any suggestion that private sector investment in productive capital or infrastructure facilities should be undertaken to promote economic growth. Economic growth has been the principal alleviator of global poverty during the past couple of centuries. It could also be argued that economic growth might serve as a vehicle for diminishing income distribution inequality if some way can be found to cause the entrepreneurial profits to be shared more evenly with the working class.
However, growth has turned out to be the main culprit in
worsening the distribution of income due to the fact that entrepreneurial
success in the private sector is rewarded by profit which propels successful
entrepreneurs into the upper-income echelons. More steeply progressive taxation
would curb the accumulation of wealth from entrepreneurial success but capture
of a substantial portion of entrepreneurial profit by progressive taxation may
also "kill the goose that laid the golden egg." And it is not clear
how the fruits of entrepreneurial success captured by progressive taxation can
help the lower half of the income distribution without redistribution.
10. Policies that Promote
Growth
Bad government forestalls growth and poverty relief. Poverty relief is a long-term process; crisis relief is a short-term palliative. Economic growth may be the best prescription for alleviating poverty, but it won't guarantee a more equitable distribution of income.
Economists have reservations about redistribution of wealth as a mode of poverty relief because of the potential for impairing incentives to work and to engage in entrepreneurial ventures. Economic growth in the last half century has been a more potent reliever of poverty than has wealth redistribution over the past twenty centuries.
So how can public policy be configured to promote poverty-relieving economic growth? Here are six public policies that can promote growth and enhance welfare at the lower ends of the income and wealth distributions:
1) Implement and subsidize education and training programs that accommodate technological advance.
2) Encourage and subsidize on-going research to develop climatically sustainable products that are consumed by the mass of the population.
3) Seriously implement and enforce laws that foster competitive market conditions.
4) Stabilize macroeconomic policy by making the timing and magnitude of government spending, taxing, and monetary policy decisions predictable.
5) Foster comparative advantage specialization by resisting the temptation to engage in "industrial policy," i.e., governmental efforts to "pick winners" by subsidizing or directing industrial and commercial activity and employment.
6) Favor open-economy
global trading relationships that can provide lower-priced goods and services
to consumers toward the lower end of the income distribution.
11. U.S. Growth in the
Twenty-first Century
Except for recession years 1991 and 2001-2002, U.S. real
economic growth rates (abstracting from inflation) between 1990 and 2005 were
in the 3.5 to 4.5 percent range. Real growth began to decrease in 2006 and
reached -2.8 percent in 2009, now called the "Great Recession." Since
2009, U.S. real economic growth rates have hovered around 2 percent per annum.
(https://www.statista.com/statistics/188165/annual-gdp-growth-of-the-united-states-since-1990/)
When did on-going and fast-enough economic growth become
a phenomenon to be desired, expected, and even demanded? Until the nineteenth
century, most people could only hope to sustain well-being at the level
experienced by their parents. Few expected well-being improvement from
generation to generation, and most hoped only to avoid famine, war, disease,
and other causes of decreasing well-being.
12. Growth and Normal Operating Capacity
Against this working definition of normal operating capacity, a working conjecture is that the normal operating capacity of the United States in 2020 was a Gross Domestic Product around $19 trillion current dollars, with population growing at about one-third percent per annum, the labor force also growing at one-third percent per annum, labor force participation rate of about 65 percent, unemployment of around 4 percent of the labor force (i.e., no more than frictional unemployment), and price inflation at about 2 percent per annum.
In late 2020, the U.S. economy suffered a Pandemic supply shock as GDP fell below its potential to around $17 trillion; population was growing at only a third of a percent per annum; the labor force grew slightly faster at a half percent per annum; and the labor force participation rate fell to 60 percent.
In the long run, an economy's normal operating capacity
tends to increase with economic growth, that is, as population grows and
productivity increases with technological advance and capital investment.
Recent experience in Western market economies indicates that the normal
operating capacities increase between 1 and 2 percent per annum but vary significantly
with cyclical or irregular macroeconomic fluctuations. If aggregate spending
fails to keep up with the pace of economic growth, the economy may experience
persistent unemployment and falling prices.
13. Aggregate Demand and
Supply
Population growth and productivity advance tend to cause the normal operating capacity of the economy to grow at some rate. This rate has ranged from 1 to 3 percent per annum in Western market economies during the last half of the twentieth century. This growth of the normal operating capacity of the economy can be expected to increase aggregate supply in both the short and long runs. The growth path that the economy follows depends critically upon whether aggregate demand also increases at some rate greater than, approximately equal to, or less that the rate of growth of aggregate supply and the normal operating capacity of the economy.
Figure 13-1 illustrates growth as a discrete rightward shift of the long-run aggregate supply curve from LRAS1 to LRAS2 as the natural rate of real output increases from N1 to N2. The short-run aggregate supply shifts along with the LRAS curve to SRAS2. This shift should be understood to be a "snapshot" of an on-going growth process. Suppose that aggregate demand grows at a relatively slow pace represented by the small shift from AD1 to AD2, which intersects SRAS2 at E2. This leaves output at Y3, well below the new natural rate of real output at N2, and unemployment correspondingly above the natural rate of unemployment.
Figure 13-1.

Deflation ensues as the price level falls from P1 to P2. As expectations begin to catch up with the falling
price level, suppliers of resources may begin to accept lower prices and wages
(in order to avert unemployment) so that costs of production fall. When this
happens, it causes SRAS to shift even further to the right (not shown) toward
the intersection of AD2 with LRAS2. As prices continue to fall, output may gradually approach the natural
rate of real output at N2.
Alternately, if in Figure 13-1 aggregate demand growth results in a much larger shift from AD1 to AD3, the price level rises from P1 toward P3 and output increases, at least temporarily, toward Y4. As output increases above the natural rate of real output N2, the actual rate of unemployment falls below the natural rate of unemployment. If AD continues to shift in such a fashion relative to the LRAS shifts in subsequent periods, there will be a tendency for chronic inflation as the economy attempts to sustain production in excess of its normal operating capacity.
The equilibrium growth path is along the upward-sloping dashed line from E1 toward E3 in Figure 13-1. As resource owners gradually become aware of the rising output prices (i.e., their costs of living) and begin to push up their own prices and wage rates, production costs rise. The initial demand-pull inflation thus induces further cost-push inflation as the SRAS curve slows its rate of rightward advance and may even begin to shift upward (not shown) toward the intersection of AD3 with LRAS2. In this scenario aggregate demand is increasing at a rate faster than short-run aggregate supply (which may actually be decreasing). A possible consequence is a slowing of the growth rate of output due to the resulting cost-push inflation.
As can be seen in Figure 13-1, an equilibrium path that
avoids both inflationary and deflationary pressures requires that aggregate
demand continue to increase at approximately the same rate as long-run
aggregate supply. This is illustrated as the shift from AD1 to AD4, with horizontal equilibrium path from E1 to E4. Under such growth conditions, the economy may enjoy relative price
stability, not unlike that experienced by the U.S. economy during the
late-1990s.
14. Aggregate Demand Growth Rate
Is there any a priori reason to expect aggregate demand to increase at a fast-enough pace? Aggregate demand can be counted upon to increase when population grows simply because there are more mouths to feed. If per capita incomes are increasing due to productivity advances, there will be an additional impetus for increases of aggregate demand. Also, it is not unreasonable to expect investment spending to increase in some proportion to the growth of the economy, simply to increase capacity by enough to meet the requirements of population growth and income increase. These three factors might be expected to yield a continuing aggregate demand increase that paces or outruns the increase of aggregate supply
However, there is another matter, the fact that democratic governments have tended to run budgetary deficits on a continuing basis. Deficits further increase aggregate demand and the aggregate expenditures. Should governments succeed in balancing their budgets, this source of aggregate demand increase will disappear. Governmental budget surpluses that are not used to retire public debt would siphon purchasing power from the economy and thus constitute a drag on the increase of aggregate demand.
And, there is the possibility that demand-pull inflationary pressures may also induce cost-pushing increases of aggregate supply which may produce the characteristics of a growth recession. This requires great care in the planning of investment for both capital replacement and capacity expansion.
It would seem that governments’ propensities to run budget deficits would ensure that aggregate demand always increases fast enough to absorb any increases of aggregate supply. However, both aggregate demand and aggregate supply collapsed in the Great Recession beginning in 2008. The U.S. government’s large stimulus spending programs during 2009-2011 have prompted aggregate demand to begin to increase slowly during the recovery, but by mid-2011 they had not been sufficient to bring down the rate of unemployment below 9 percent of the labor force.
p class="MsoNormal" style="line-height: normal; margin-bottom: 0in; mso-layout-grid-align: none; mso-pagination: none; text-autospace: none;">The U.S. budget deficit of over $1 trillion during the government's 2010-2011 fiscal year has brought its public debt up to around $14 trillion, nearly the same as the nation's Gross Domestic Product. As Congress debated until just before a deadline whether to approve yet another increase in the public debt limit, concerns about the ability and willingness of the U.S. government to continue to honor its outstanding debt led a debt rating agency, Standard and Poor, to downgrade the U.S. public debt from AAA to AA+ in July of 2011.As evidenced by the experience of the Great Recession, uncertainty and low levels of business and consumer confidence may cause aggregate demand to increase too slowly relative to even a slow rate of increase of aggregate supply during the recovery. This may occur if unemployment benefits are “too rich” relative to the prospects for earning income in work, if technology is advancing so that out-of-work persons lack the requisite skills for the available jobs, or if people who are unemployed are reluctant to take jobs below their skill levels or at wages less than they earned in their prior employments.
Aggregate demand may also increase too slowly if business decision makers are pessimistic about future market growth potential, if they suffer uncertainty about the regulatory environment, or if they are increasing labor productivity by investing in labor-saving technologies to avoid calling back workers who have been laid off earlier in the recession. When aggregate demand stagnates or increases at a slower pace than aggregate supply, the economy may suffer persistent high unemployment and stagnant or even declining average incomes
15. Growth and Supply Shocks
A supply shock can interrupt an on-going process of economic growth.
In late 2020, the U.S. economy suffered a Pandemic supply shock as GDP fell below its potential to around $17 trillion; population was growing at only a third of a percent per annum; the labor force grew slightly faster at a half percent per annum; and the labor force participation rate fell to 60 percent as workers were laid off and others resigned their jobs.
A supply shock manifested as a sudden decrease of aggregate supply may quickly cause product shortages as inventories begin to shrink. In such a market environment, prices become firmer and managers may be tempted to take the occasion to raise prices. As the higher prices become translated into increasing production costs, cost-push inflation ensues. With worsening unemployment which lowers spendable income, aggregate demand can be expected to fall, tending to bring prices back to original level before the shock.
Disequilibrium results when aggregate spending decreases and the output of the economy falls below its normal operating capacity. Such a disequilibrium manifests itself at the macroeconomic level as an accumulation of inventories by business firms at the microeconomic level. Unwanted inventory accumulation reflects the unmet intentions of business decision makers to sustain or increase sales. Production level cuts in response to the increasing inventories increase unemployment, and product prices begin to soften. However, prices may be somewhat sticky in the downward direction. If prices do not decrease to absorb some of the aggregate demand collapse, the brunt of the adjustment must be borne by falling output.
As the COVID-19 Pandemic shock unfolded during 2020 and
early 2021, U.S.economic growth slowed as the economy departed
from its normal operating capacity.
·
The U.S. population growth rate had fallen from 0.946% per annum in 2008 to
0.351% in 2020 (https://data.worldbank.org/indicator/SP.POP.GROW?locations=US).
·
The labor force growth rate was projected to fall below 0.5% per annum (https://www.bls.gov/opub/mlr/2015/article/labor-force-projections-to-2024.htm).
·
The labor force participation rate fell to 60.2 percent in April 2020 (https://fred.stlouisfed.org/series/CIVPART).
·
The unemployment rate jumped to more that 14 percent in April 2020 before
gradually subsiding to 4.5 percent by October 2021 (https://www.bls.gov/news.release/pdf/empsit.pdf).
·
The CPI inflation rate increased from 1.4% per annum in January, 2021, to
5.4% in June where it remained until October when it jumped to 6.2% (https://tradingeconomics.com/united-states/inflation-cpi).
· U.S. manufacturing and trade inventories averaged around 1.4% of sales from 2016 through 2019, then spiked to 1.7% (a 22 percent increase) early in 2020 before falling to 1.25% by late 2021 (a 26 percent decrease) (https://www.census.gov/mtis/www/data/pdf/mtis_current.pdf).
The supply shock was aggravated during late 2021 in the
run-up to the end-of-year holiday buying season when import bottlenecks
developed at major ports. As inventories further depleted, managers attempted
to import more merchandise and equipment, and they revised production plans to
increase output. With recovery of the economy in 2022, aggregate demand has increased and the economy has resumed a more normal process
of economic growth but with rising inflation.
16. Growth and the Natural Rate of Interest
Economists conventionally identify four “factors of production,” land, labor, capital, and entrepreneurship, and the so-called returns to them, respectively, rent, wage, interest, and profit. Since interest is the return to real capital (physical productive capacity, e.g., plant, equipment, housing), the "true" interest rate in any region is a measure of the scarcity of capital in the region relative to the demand for it.
This "scarcity rate" of interest corresponds to Knut Wicksell's concept of the "natural rate" of interest as "a certain rate of interest on loans which is neutral in respect to commodity prices and tends neither to raise nor to lower them" (https://en.wikipedia.org/wiki/Neutral_rate_of_interest#:~:text=The%20neutral%20rate%20of%20interest%2C%20previously%20called%20the,keeping%20inflation%20constant.%20It%20cannot%20be%20observed%20directly.). Natural rates of interest may be lower in more developed parts of the world that are capital-abundant; we should expect natural rates to be higher in lesser developed regions of the world that are capital-scarce relative to local demands for capital. The marginal productivities of new capital investments would be higher in such regions, inviting "offshore" investments in those regions by firms located in other regions with more abundant capital and thus lower marginal productivities of capital.
Although the natural rate of interest is not directly observable, yields on longer-term government bonds that are essentially riskless may serve as proxies for the natural rate of interest. James Mackintosh, writing in The Wall Street Journal September 2, 2016, notes that
The new debate in central banking is over whether long-run interest rates are lower than in the past, thanks to permanently lower growth. Investors seem to share the view of many policy makers that they are: Long-dated bond yields have plummeted around the world. . . . . The president of the Federal Reserve Bank of San Francisco, John Williams, set the tone for the gathering of central bankers at Jackson Hole, Wyo., last month when he published a widely read letter suggesting the long-run "natural" rate of interest has come down drastically in the past 25 years.
(http://blogs.wsj.com/economics/2016/09/02/think-you-know-the-natural-rate-of-interest-think-again/)

Economic growth in a region occurs when net investment spending is positive, i.e., when gross investment exceeds depreciation to increase the capital stock. As shown in the upper panel of Chart 2, yield rates on 30-year term U.S. Treasury bonds indeed have come down over the period between 1980 and 2019. This has not been due to permanently lower growth, but rather because the stocks of real capital in developed countries such as the U.S., Canada, the U.K., and certain E.U. countries have increased with positive net investment.
Natural adjustment processes in a market economy tend to cause long-term market interest rates to gravitate toward the economy's natural rate. The lower panel of Chart 2 shows the Holston-Laubach-Williams (unofficial) estimates of the natural rate of interest for the U.S. from 1985 to 2022. A comparison of the upper and lower panels of Chart 2 shows that the 30-year bond yield rate has fallen along with the Holston-Laubach-Williams estimates since 2000. Although the natural rate of interest cannot be directly observed or tracked, yield rates on 30-year bonds often are taken as proxies for the natural rate of interest.

An increase of the stock of capital in a region tends to lower the marginal productivity of capital in that region. Lower rates of economic growth are not causes of falling longer-term interest rates; they are consequences of the declining marginal productivity of capital stocks that have increased relative to other factors of production (labor, natural resources). And lower yield rates on longer-term bonds which proxy falling natural rates of interest are attributable to the declining marginal productivities of the increasing capital stocks in those regions. Although U.S. GDP growth might have been expected to increase at a decreasing rate because of decreasing marginal productivity of capital, the GDP growth path depicted in the upper panel of Chart 1 likely has been concave upward because of technological advances that have increased productivity.
Historical data for the productivity of labor are readily available, but corresponding data for the productivity of capital are not. Chart 3 enables comparison of labor productivity to Total Factor Productivity (TFP, the combination of labor and capital productivity) for the period 1954 to 2018. The difference between the two graphs implies what happened to capital productivity. Labor productivity increased by over 70 percent during the period, but TFP increased by less than 50 percent during the same period. This is not surprising since an increase in the stock of capital would be expected to increase the marginal productivity of labor but decrease the marginal productivity of capital. The slower rate of increase of TFP implies that capital productivity decreased to offset the gain in labor productivity as would be expected due to diminishing returns to capital.

The economic theory of production provides a simple explanation of why growth slows as an economy matures. The stock of capital naturally suffers the phenomenon of diminishing returns as it increases relative to other factors of production. We should expect the marginal productivity of capital to be lower in advanced regions where capital is more abundant and higher in lesser-developed regions where capital is scarce. As the stock of capital increases relative to the labor force in a region, the marginal productivity of capital decreases even as it increases the marginal productivity of labor. It is diminishing returns to capital, i.e., the decreasing marginal productivity of capital, that causes growth to slow. But on-going technological advance may offset diminishing returns to capital to avert the end of growth.
Diminishing Returns
Most real world production processes exhibit the phenomenon of diminishing returns, i.e., beyond some point, output begins to increase at a decreasing rate. A graphic model of a diminishing returns production process is illustrated in Chart 9. The back walls of a 3-dimension (3rd order) production surface are illustrated in quadrant I as outlined by the path
0ABC0
in which product output (Q) is on the vertical axis, and amounts of labor (L) and capital (K) are on the right and left floor axes, respectively. The total product function label Q = f ( L , K | . . . ) may be read, "output is a function of the amounts of labor and capital, given fixed amount of all other inputs."

In quadrant III, a slice through the 3-D surface illustrates increasing the amount of labor used in an installed capital stock (plant and equipment) of K2. The total product function label Q = f ( L | K2 , . . . ) may be read, "output is a function of the amount of labor, given the K2 plant and fixed amounts of all other inputs." As the amount of labor is increased in this plant, output at first increases at an increasing rate from K2 to point E. Using more labor beyond the L1 amount causes output to increase at a decreasing rate along the path from E to F, G, H, and J. This is depicted by the downward concavity of the total product slice beyond the L1 amount of labor. The downward concavity of the total product slice beyond the L1 amount of labor illustrates the phenomenon of diminishing returns to labor when the amount of capital is fixed.
The figure in quadrant V of Chart 10 depicts for the K2 amount of capital the average product curve, APL = (Q / L), and the marginal product curve, MPL = (?Q / ?L) for the smallest possible ?Q. Marginal product measures the rate of change of total product, i.e., the slope of the Q function along the K2 slice from E to F, G, H, and J. APL at first is greater than MPL but turns down and passes through the peak of MPL at the L2 amount of labor. Beyond the L2 amount of labor, MPL decreases (slopes downward) until it reaches zero on the labor axis at L5, corresponding to the maximum amount of product that can be produced, given the K2 installed plant. The downward sloping range of the MPL curve illustrates the phenomenon of diminishing returns to labor, given the K2 amount of capital.

Capital often is thought of as a fixed input to which labor is added as the variable input. But in some production processes the amount of labor is fixed (e.g., members of the family on a family farm) while the amount of capital can be varied by acquiring more or disposing of some equipment. Quadrant VI of Chart 10 illustrates diminishing returns to capital, given a fixed amount of labor, L2. The previous paragraph could be repeated with L and K swapped to reveal the phenomenon of diminishing returns to capital illustrated by the downward concavity of the Q = f ( K | L2 , . . . ) function beyond the K1 amount of capital and the downward slope of the MPK curve beyond the K2 amount of capital.
The figures in quadrants VII and VIII of Chart 10 show that every point along a Q slice of the production function for a fixed amount of one factor is also on a Q slice for a fixed amount of the other factor. In the quadrant VII diagram, as the amount of labor is increased in a fixed plant K2, the slope of the Q function path decreases but the slopes of the cross-cutting K slices increase. Another way to describe this is that with an increasing amount of L, given the K2 plant, the marginal product of L decreases while the marginal product of K increases. And this also would be true in quadrant VIII as the amount of capital is increased for use by a fixed amount of labor L2. Increasing the amount of capital, given a fixed amount of labor, will increase the marginal product of labor even as the marginal product of capital decreases.
Technological advance that improves the efficiency of both of the factors of production would shift the 3-D surface 0ABC0 upward and outward along both of their axes to forestall the effects of diminishing returns to both factors. The marginal product curves of both factors also would shift upward and outward to forestall the effects of diminishing returns. Technological advance that improves the efficiency of only one of the productive factors will skew the surface upward and outward only along the axis of that factor. Such technological advance would forestall diminishing returns to that factor and increase the productivity of the other factor.
17. The Malthusian Growth Model
Thomas R. Malthus argued in his famous 1798 “Essay on Population” that population growth may press upon the carrying capacity of the earth. A modern interpretation of Malthus’ hypothesis is that as population grows, and with it the quantity of labor, per capita income will fall until it reaches the subsistence level. If it falls below subsistence requirements, Malthus thought that enough people would starve to stabilize the population with income levels hovering about the subsistence level. Malthus, a Church of England parson, invoked the “four horsemen of the apocalypse” (described in Chapter 6 of the book of Revelation) to represent the forces that would constrain population growth: war, pestilence, disease, and famine.
In economic theory the Malthusian prospect is analyzed with a production function in which output is the dependent variable and labor is an independent variable. Other resources (land, capital, materials) are assumed to be given and fixed in supply. The production function exhibits what economists call the phenomenon of “diminishing returns,” i.e., as one input (labor) increases relative to quantities of other inputs (capital, materials), output will increase at a decreasing rate, eventually reach a maximum, and then decrease absolutely.
In the figure following, Q is the quantity of output (product); L is the quantity of labor available (a proportion of the population); TP is total product that varies as the labor input is changed; APL is average product of labor, a.k.a. output per capita of labor; MPL is marginal product of labor; S is the subsistence requirement for a laborer and his dependents. Diminishing returns occurs between the L1 and L3 quantities of labor as output (TP) increases at a decreasing rate (i.e., TP increases but is concave downward). Marginal productivity is maximized at the L1 quantity of labor. Output per capita (APL) is maximized at the L2 quantity of labor. Total output (TP) is maximized at the L3 quantity of labor (also the quantity at which MPL is zero).

The Malthusian model explains slow economic growth as a result of population growth that continually undermines the gains from growth.
18. Technological Advance and Demographic Transition
Two phenomena thus far have averted the Malthusian prospect on global scale (although it can be argued that it has been manifested in certain third-world countries). One is that technological advances in agriculture during the nineteenth and twentieth centuries have succeeded in vastly increasing the food production capacity of the earth. The distribution of foodstuffs from excess production regions to deficit regions remains a problem.
The second phenomenon is demographic transition. Scientists concerned with population issues have observed that with the introduction of modern medical technologies into a low-income region with high birth and death rates, the death rate in the region falls, causing an increase of the population growth rate. However, as the per-capita income of the region increases with economic growth, people begin to have smaller families so that the birth rate tends to fall toward the lower death rate. This has the effect of reducing the population growth rate and stabilizing the population of the region. Why people tend to have fewer children as per capita income increases is a subject of continuing analysis and debate by natural and social scientists.
The Barcelona Field Studies Center provides an excellent graphic illustration of the phenomenon of demographic transition (https://geographyfieldwork.com/DemographicTransition.htm):
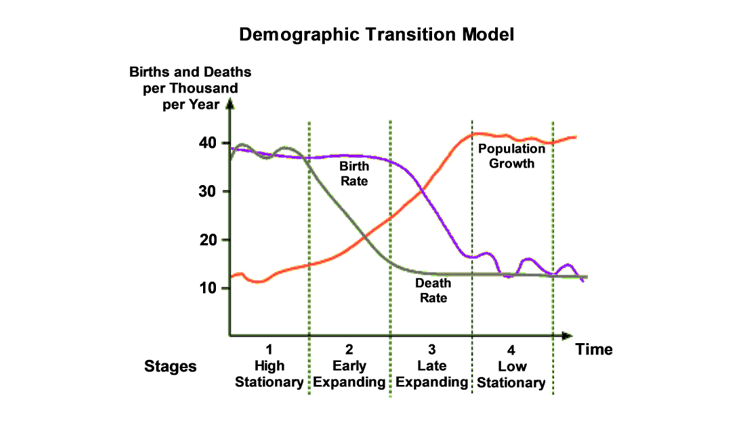
Population growth spurts in low-income, slow-growing countries imply that they are in the middle of their demographic transitions, perhaps near the boundary between stages 2 and 3, with attendant problems of feeding their burgeoning populations. While many advocate government action to address the population growth problem, the proper role for government to play is a topic of ongoing debate. Some have advocated that governments and NGOs (non-government organizations) implement a “family planning” approach (a euphemism for birth control) in those regions. Others have posited that the best hope for reducing their rates of population growth lies in improving the status of women and promoting economic growth to raise per capita incomes and induce completion of their demographic transitions.
The dual phenomena of technological advance and demographic transition have slowed global population growth, and there is a possibility that the global population may at some future time stabilize as high population-growth regions enjoy income increases sufficient to complete their demographic transitions. However, demographic transitions can go too far as revealed in several European countries. Birth rates in those regions have fallen so far relative to the declining death rates as to render population growth rates negative.
19. Depopulation and Immigration
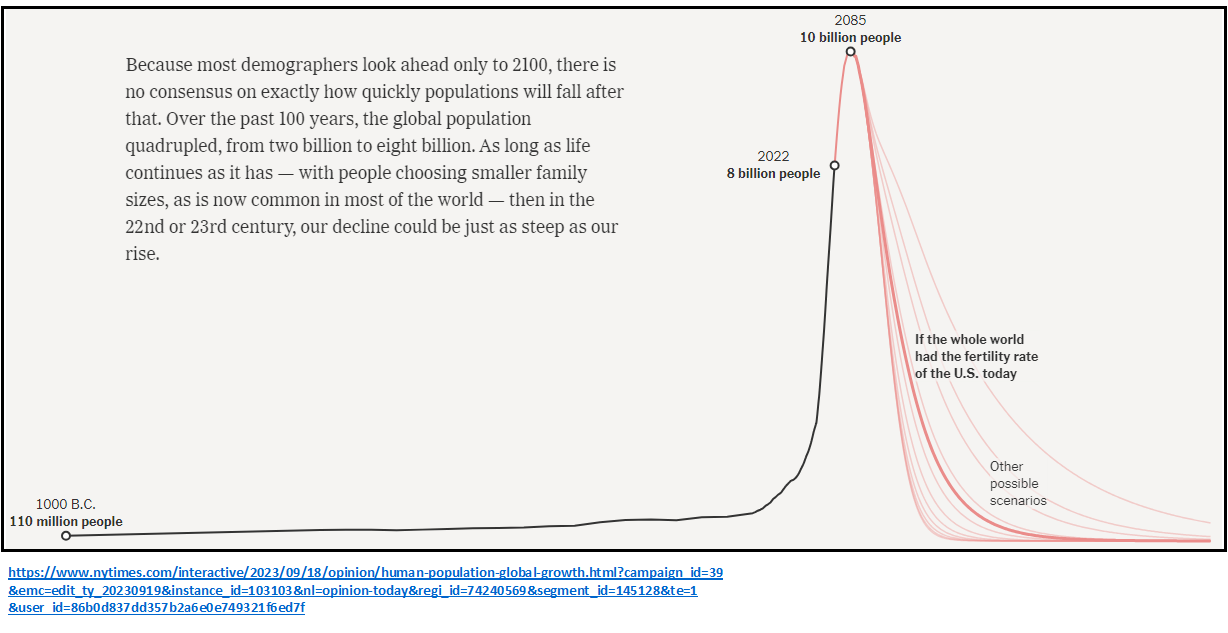
As reported in a New York Times opinion column dated September 18, 2023, demographers have noted that birthrates globally are falling:
Most people now live in countries where two or fewer children are born for every two adults. If all people in the United States today lived through their reproductive years and had babies at an average pace, then it would add up to about 1.66 births per woman. In Europe, that number is 1.5; in East Asia, 1.2; in Latin America, 1.9. Any worldwide average of fewer than two children per two adults means our population shrinks and in the long run each new generation is smaller than the one before.
....
The main reason that birthrates are low is simple: People today want smaller families than people did in the past. That’s true in different cultures and economies around the world. It’s what both women and men report in surveys. (https://www.nytimes.com/interactive/2023/09/18/opinion/human-population-global-growth.html?campaign_id=39&emc=edit_ty_20230919&instance_id=103103&nl=opinion-today®i_id=74240569&segment_id=145128&te=1&user_id=86b0d837dd357b2a6e0e749321f6ed7f)
In the same column it was noted that demographers have predicted that, due to higher living standards and falling birth rates, the global population of the earth, currently around 8 billion, likely will peak around 10 billion in the 2080s, and then decline.
If the world’s fertility rate were the same as in the United States today, then the global population would fall from a peak of around 10 billion to less than two billion about 300 years later, over perhaps 10 generations.
....
A depopulating world is a big change that we all face together. It’s bigger than geopolitical advantage or government budgets. It’s much bigger than nationalistic worries over which country or culture might manage to eke out a population decline that’s a little bit slower than its neighbors’.
Nationalistic concerns over which countries might manage slower population declines are playing out in the political issue of immigration. In the interest of encouraging domestic employment or preserving national identity, many nations now restrict immigration. But economic growth has ensued most rapidly in countries whose populations continue to grow due to immigration and despite falling birth rates.
Along with industrialization and technological advance, immigration has been an engine of growth in the United States throughout its entire history. But the Biden administration currently (November 2023) suffers criticism by Republicans for pursuing what they call an "open borders" immigration policy. New York Times columnist David Leonhardt, in "The Morning" newsletter on November 6, 2023, describes Biden's immigration policy:
Undocumented migration to the U.S. surged after Biden took office, partly in response to his welcoming campaign rhetoric, and many Americans are unhappy about the surge. Although Biden has since taken steps to reduce the surge, he rarely emphasizes these popular steps. (https://messaging-custom-newsletters.nytimes.com/template/oakv2?campaign_id=9&emc=edit_nn_20231106&instance_id=107032&nl=the-morning&productCode=NN®i_id=74240569&segment_id=149290&te=1&uri=nyt%3A%2F%2Fnewsletter%2F0b00acd6-c606-5652-818d-aa0415b664f1&user_id=86b0d837dd357b2a6e0e749321f6ed7f)
In a New York Times column dated November 11, 2023, Charlie Savage, Maggie Haberman, and Jonathan Swan detail Donald Trump's proposed immigration policy if he is reelected in 2024:
Former President Donald J. Trump is planning an extreme expansion of his first-term crackdown on immigration if he returns to power in 2025 — including preparing to round up undocumented people already in the United States on a vast scale and detain them in sprawling camps while they wait to be expelled.
....
The constellation of Mr. Trump’s 2025 plans amounts to an assault on immigration on a scale unseen in modern American history. Millions of undocumented immigrants would be barred from the country or uprooted from it years or even decades after settling here. (https://www.nytimes.com/2023/11/11/us/politics/trump-2025-immigration-agenda.html?campaign_id=9&emc=edit_nn_20231112&instance_id=107544&nl=the-morning®i_id=74240569&segment_id=149815&te=1&user_id=86b0d837dd357b2a6e0e749321f6ed7f)
An expected recession thus far has been averted, inflation has abated, and the U.S. economy continues to grow under the Biden administration's immigration policies.
As the U.S. birth rate continues to decline, the population will age with ever fewer young people to support and serve the increasing elderly cohort. Trump's proposed policies to stop immigration could offset the declining birth rate to increase the younger population in support of the elderly.
It is the young and capable members of any society who are driven to seek better lives for themselves by emigrating. Immigration may enable continuing growth and welfare enhancement of the U.S. economy during the run-up to the global population peak late in the 21st century and beyond.
Immigration may benefit the United States as global depopulation ensues in the twenty-second century, but those nations from which people emigrate to the United States likely will suffer ever slower economic growth and faster demographic decline.
20. The Harrod Growth Model
In a 1939 paper ("An Essay in Dynamic Theory," The Economic Journal), Roy F. Harrod proposed a theory of growth in the context of the "Keynesian cross" diagram. His theory suggested that there is an appropriate or "warranted" rate of growth of the economy to allow sustained growth of output without inflation.

A graphic depiction of the Harrod model is illustrated in Figure 20-1. The economy is presently in equilibrium at point A and operating at output level Y1, that is below the full-employment output level, Yf.

An increase of investment spending from I1 to I2 that also shifts aggregate expenditure upward from AE1 to AE2 as illustrated in Figure 20-2, results in inventory depletion represented by line segment AB. This sets in motion a process of expansion in the economy until it reaches a new equilibrium at point H with output level at Y2 which coincides with the former full employment output level. However, the additional investment spending has created additional productive capacity by adding to the stock of productive capital in the economy, thereby increasing the full-employment output level to Yg. At Yg, even more investment in the amount from J to K is needed in order to achieve the new full employment level of output at K. The additional investment creates additional capacity and the economy continues to suffer unemployment.

The problem of the wedge of saving may be exacerbated if
progressive income taxation or some other phenomenon tends to make the
consumption function flatten out at higher income levels (become concave
downward) as illustrated in Figure 20-3. In this case, the wedge will become an
ever-widening funnel which must filled-up with injections of spending. If the
wedge cannot be so filled-up with additional spending, an economy with a
growing labor force will suffer slower growth characterized by persistently
high unemployment and flat or falling average incomes.

Harrod's analysis concludes that the right or "warranted" rate of output growth can be estimated by computing the
ratio of the marginal propensity to save (?S/?Y) to the marginal capital-output ratio (?K/?Q). ?S is net saving, i.e., gross saving after subtracting depreciation. The required injection growth rate then depends upon the value of the effective multiplier. Any output growth rate in excess of the warranted rate will result in chronic inflationary pressures; any output growth rate less than the warranted rate will produce chronic recession and deflationary pressures (i.e., growth recession or secular stagnation).
Criticisms of the Harrod model have included assumptions that labor and capital are used in equal proportions, the net savings rate is constant, the marginal product of capital is constant, and productive capacity varies in proportion to the stock of capital.
21. THE SOLOW GROWTH MODEL
THE SOLOW GROWTH MODEL
All of Solow's exogenously determined rates are assumed constant or given: LFPR, the labor force participation rate; n, the population growth rate; s, the saving rate [Keynes' MPS]; d, the straight-line depreciation rate; and z, the rate of technological progress.
All relationships may be expressed on a per-worker basis, i.e., Y/L = f ( K/L, L/L), y = f (k), c = y - s, i = s, and Dk = ( i - d ). With aggregate production function Y = AKaL1-a, the per worker production function is y = Aka. The saving and depreciation rates may be expressed, respectively, as s = s(y) and d = d(k).
INFERENCES AND CONCLUSIONS FROM THE SOLOW MODEL
A steady state will persist until any one (or more) of the exogenous rates change, but a steady state of y may not be optimal. An optimal state y** occurs where c is maximized, i.e., where the slope of y is equal to the slope of d, i.e., where dy/dk = d. There is nothing in the model that takes y* to y**.
A change of any of the exogenously determined parameters changes the steady state: an increase of LFPR decreases k* and y*; an increase of n decreases k* and y*; an increase of s increases k* and y*; an increase of d decreases k* and y*; and an increase of z increases k* and y*. A steady-state change causes mid-term (but only temporary) growth during the transition.
There are limits to the ability of a society to increase s, or to decrease n, LFPR, or d. Only successive improvements of z cause permanent [on-going] growth. There is no limit in the potential increase of z, so technological progress is the source of permanent growth.

At capital stock k1*, gross investment i1 exceeds depreciation d1 by the amount of the line segment FC. This net investment causes the capital stock to increase from k1* to k2* between times t1 and t2. (The k-axis is expanded relative to the output axis so that the effect of the net investment can be observed.)
The dynamic growth path of output from point A on slice y1 to point B on slice y2 is attributed to the net investment that increased the capital stock. Output increased from the height of line segment HA to the height of the line segment GB, and consumption increased from CA to DB. The downward-concavity of the up-sloping growth path implies that although the stock of capital increased, the marginal productivity of capital is decreasing, thus confirming the property of diminishing returns to capital.
TECHNOLOGICAL PROGRESS IN THE SOLOW MODEL
POPULATION GROWTH IN THE SOLOW MODEL
Population growth may be endogenized in the Solow model. Population growth enhances the creation of new technology because it increases the investment or production that generates new ideas. Even without generating new ideas, population growth increases the scale of the economy, thereby permitting firms, industries, and the entire economy to exploit economies of scale. Models of intentional R&D activity treat population growth (more workers) as a direct input into the production function of technology that enhances the economy's ability to overcome diminishing returns.
ASSESSMENT OF THE SOLOW MODEL
(https://eml.berkeley.edu/~dromer/papers/MRW_QJE1992.pdf)
Popular posts from this blog
EssaysVolume6

StanfordCollectedEssays
EssaysVolume12

Comments
Post a Comment